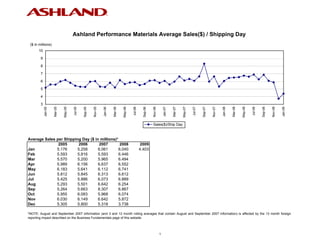
1. Ashland Performance Materials Average Sales($) / Shipping Day
($ in millions)
10
9
8
7
6
5
4
3
May-05
May-06
May-07
May-08
Nov-05
Nov-06
Nov-07
Nov-08
Mar-05
Mar-06
Mar-07
Mar-08
Jan-05
Jul-05
Sep-05
Jan-06
Jul-06
Sep-06
Jan-07
Jul-07
Sep-07
Jan-08
Jul-08
Sep-08
Jan-09
Sales($)/Ship Day
Average Sales per Shipping Day ($ in millions)*
2005 2006 2007 2008 2009
Jan 5.176 5.258 6.061 6.040 4.403
Feb 5.593 5.816 5.593 6.446
Mar 5.570 5.200 5.965 6.494
Apr 5.989 6.156 6.637 6.552
May 6.183 5.641 6.112 6.741
Jun 5.812 5.845 6.313 6.612
Jul 5.425 5.886 6.073 6.889
Aug 5.293 5.501 6.642 6.254
Sep 5.264 5.663 8.307 6.867
Oct 5.955 6.083 5.968 6.074
Nov 6.030 6.149 6.642 5.872
Dec 5.305 5.800 5.318 3.738
*NOTE: August and September 2007 information (and 3 and 12 month rolling averages that contain August and September 2007 information) is affected by the 13 month foreign
reporting impact described on the Business Fundamentals page of this website.
1
2. Ashland Performance Materials Revenue
($ in millions)
175
150
125
100
75
May-05
May-06
May-07
May-08
Nov-05
Nov-06
Nov-07
Nov-08
Mar-05
Mar-06
Mar-07
Mar-08
Jan-05
Jul-05
Sep-05
Jan-06
Jul-06
Sep-06
Jan-07
Jul-07
Sep-07
Jan-08
Jul-08
Sep-08
Jan-09
Monthly Sales 12 Month Rolling Average
Monthly Sales ($ in millions)* 12 Month Rolling Average ($ in millions)*
2005 2006 2007 2008 2009 2005 2006 2007 2008 2009
Jan 103.5 110.4 133.3 132.9 92.5 Jan 94.3 118.4 121.9 132.1 127.8
Feb 111.9 116.3 111.6 135.4 Feb 96.5 118.8 121.5 134.0
Mar 122.5 119.6 131.2 129.9 Mar 99.4 118.5 122.4 133.9
Apr 125.8 117.0 132.7 144.2 Apr 102.3 117.8 123.8 134.9
May 129.9 124.1 134.5 141.6 May 106.0 117.3 124.6 135.5
Jun 127.9 128.6 132.6 138.9 Jun 108.4 117.4 125.0 136.0
Jul 108.5 117.7 127.5 151.6 Jul 110.0 118.1 125.8 138.0
Aug 121.7 126.5 152.8 131.3 Aug 112.3 118.5 128.0 136.2
Sep 110.5 113.3 157.8 144.2 Sep 114.1 118.8 131.7 135.1
Oct 125.1 132.8 137.3 139.7 Oct 115.8 119.4 132.1 135.3
Nov 120.6 123.0 132.8 105.7 Nov 117.1 119.6 132.9 133.0
Dec 106.1 110.2 101.0 78.5 Dec 117.8 120.0 132.1 131.1
*NOTE: August and September 2007 information (and 3 and 12 month rolling averages that contain August and September 2007 information) is affected by the 13 month foreign
reporting impact described on the Business Fundamentals page of this website.
2
3. Ashland Performance Materials Gross Profit %
%
26.0
24.0
22.0
20.0
18.0
16.0
14.0
12.0
May-05
May-06
May-07
May-08
Nov-05
Nov-06
Nov-07
Nov-08
Mar-05
Mar-06
Mar-07
Mar-08
Jan-05
Jul-05
Sep-05
Jan-06
Jul-06
Sep-06
Jan-07
Jul-07
Sep-07
Jan-08
Jul-08
Sep-08
Jan-09
3 Month Rolling Average 12 Month Rolling Average
3 Month Rolling Average (%)* 12 Month Rolling Average (%)*
2005 2006 2007 2008 2009 2005 2006 2007 2008 2009
Jan 17.3 21.3 20.5 17.3 17.1 Jan 18.9 21.8 22.2 19.4 16.6
Feb 18.6 22.2 19.7 17.1 Feb 18.9 21.9 21.9 19.4
Mar 20.7 22.9 20.5 18.1 Mar 18.8 22.1 21.7 19.1
Apr 21.5 23.4 21.0 18.5 Apr 19.0 22.3 21.6 18.9
May 21.6 24.2 21.4 18.1 May 19.3 22.5 21.2 18.5
Jun 22.6 25.0 21.9 17.5 Jun 19.7 22.8 21.0 18.0
Jul 22.7 24.6 21.2 16.1 Jul 19.9 22.8 20.8 17.6
Aug 22.9 22.8 20.1 14.6 Aug 20.2 22.5 20.5 17.1
Sep 21.2 20.3 18.1 14.6 Sep 20.4 22.5 20.3 17.0
Oct 21.6 20.4 18.4 14.8 Oct 20.9 22.4 20.2 16.7
Nov 20.9 20.8 18.7 16.1 Nov 21.1 22.5 20.0 16.5
Dec 21.6 21.1 18.2 15.9 Dec 21.6 22.3 19.6 16.6
*NOTE: August and September 2007 information (and 3 and 12 month rolling averages that contain August and September 2007 information) is affected by the 13 month foreign
reporting impact described on the Business Fundamentals page of this website.
3